Case Study
Home ยป Designing a Dashboard for Real-Time Logistics Tracking
Designing a Dashboard for Real-Time Logistics Tracking
Problem Statement
A logistics company managing large-scale transportation and delivery networks across multiple regions was facing delays in tracking fleet activity, delivery statuses, and warehouse operations. Their legacy system lacked a centralized, real-time interface, making it difficult for dispatchers, managers, and clients to monitor logistics efficiently. They needed a responsive and data-driven dashboard UI that offers real-time tracking, alerts, and performance metrics in a user-friendly format.

Challenge
Data Overload: Visualizing complex, high-volume data without overwhelming the user.
User Roles: Creating personalized views for operations teams, delivery managers, and customers.
Real-Time Updates: Ensuring real-time synchronization of vehicle locations, delivery statuses, and route performance.
Cross-Device Compatibility: Dashboard needed to be accessible on desktops, tablets, and mobile devices.
Solution Provided
A modern, responsive logistics dashboard was designed with a focus on clarity, efficiency, and usability. The design process followed a user-centered approach, involving stakeholders across the logistics chain.
Key Features:
Real-time vehicle tracking with GPS map integration.
Custom alerts for delays, route deviations, or fuel issues.
KPI widgets for delivery time, order volume, and driver performance.
Role-based dashboards (e.g., dispatch vs. client view).
Responsive grid layout with collapsible sidebars and data filters.
Development Steps

User Research & Workflow Mapping
Conducted interviews and mapped the journey of operations, dispatchers, and clients to define key use cases.

Wireframing & Prototyping
Created low and high-fidelity wireframes using Figma to simulate interactions, filters, and data panels.

Visual Design
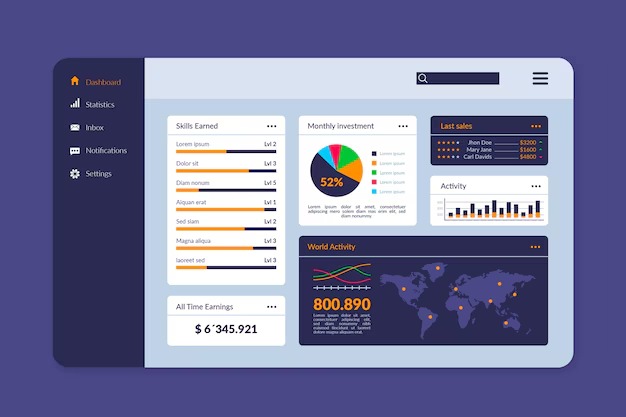
Used a clean, modular design system with consistent typography, icons, and color coding for priority levels (e.g., delayed, on-time, completed).

Data Visualization
Integrated real-time charts and map components for deliveries using Chart.js and Mapbox mockups in the prototype.

User Testing
Tested prototypes with logistics personnel, iterating on feedback around information hierarchy and alert visibility.

Handoff & Dev Collaboration
Provided annotated design files, interaction specs, and component library to the development team for efficient build-out.
Results

Improved Decision-Making
Real-time dashboards enabled faster response to route issues and delivery exceptions.

Reduced Manual Tracking
Cut down manual log entries by 70%, improving workflow automation.

Better User Experience
90% of users found the dashboard easier to use and more informative compared to the legacy system.

Faster Load Times & Responsiveness
Optimized UI ensured smooth usage even during peak traffic and heavy data loads.

Increased Visibility
Stakeholders could now monitor fleet movement, warehouse inventory, and performance metrics from one centralized view.